Vista Previa de la Imagen
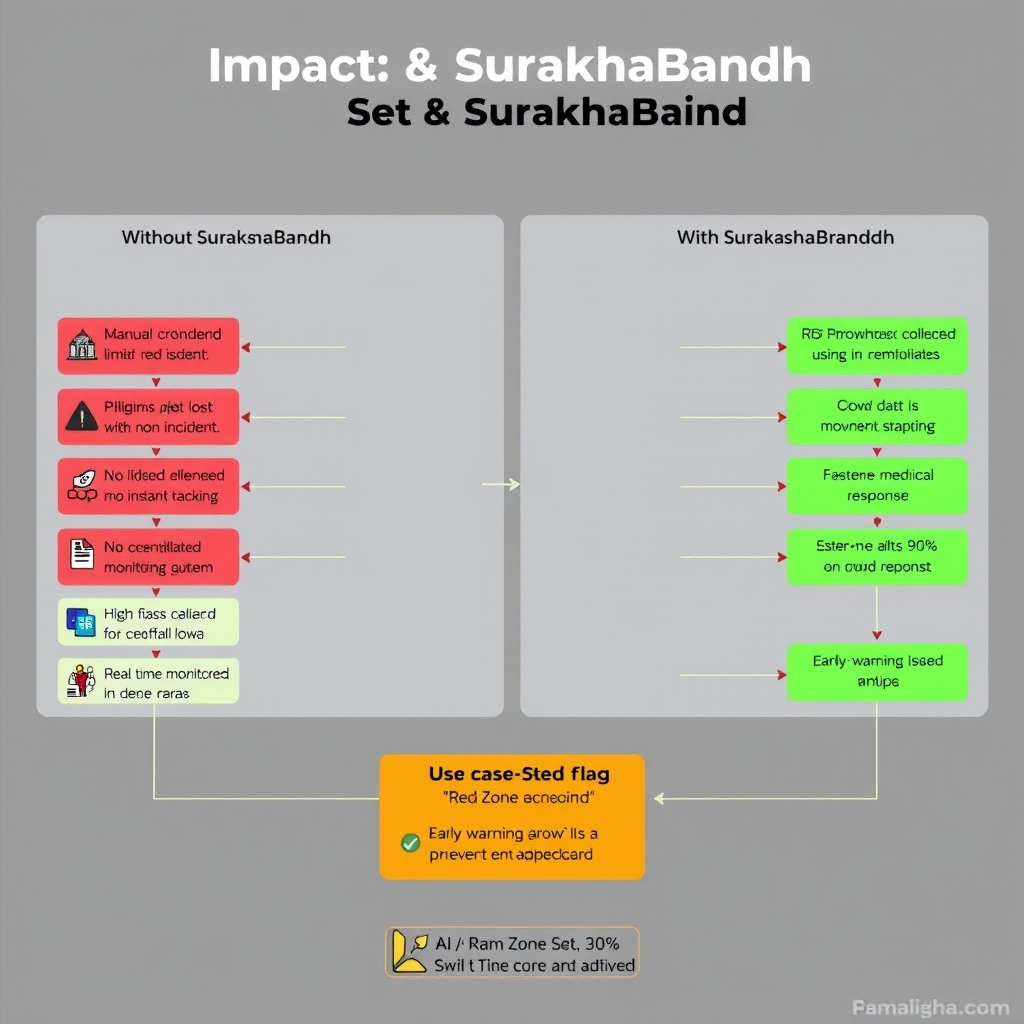
Prompt: Create a detailed comparison flowchart titled "Impact & Use Cases of SurakshaBandh". Use a split-screen layout with a bold center heading. On the **Left Side**, title it "Without SurakshaBandh" and use **red color-coded boxes**. Add icons like a red warning sign, disconnected people, and paper files. Add the following points in individual boxes: 1. Manual crowd control with limited visibility 2. No centralized monitoring system 3. Pilgrims often get lost with no instant tracking 4. Emergency response is delayed and inefficient 5. Crowd data is collected post-incident 6. High risk of stampedes in dense areas On the **Right Side**, title it "With SurakshaBandh" and use **green color-coded boxes**. Add icons like radar signals, people with RFID tags, and dashboard monitors. Add these points in individual boxes: 1. AI-based Red Zone Alerts using live footfall data 2. RFID wristbands for pilgrim movement tracking 3. Real-time monitoring dashboard for authorities 4. Automated alerts to manage crowd flow 5. Faster medical/emergency response 6. Early-warning systems to prevent disasters Connect similar points on both sides using dashed arrows showing transition from old to new. Add a **Use Case Section** at the bottom: Title: “Use Case – Ramghat Red Zone Scenario” Use a side-by-side mini-flow: - Step 1: Crowd density at Ramghat reaches 90% - Step 2: AI flags it as ‘Red Zone’ on admin dashboard - Step 3: Pilgrim flow is redirected in real-time - Step 4: Potential stampede is avoided Make sure layout is clean and colorful. Use green check icons for solutions and red crosses for problems.
Creado en: 2025-08-03T09:36:16.365